

What can you do with Spiral Graph? Help us understand how galaxies evolve.
For immediate release ‐ March 13, 2020
Contact: Jon Pishney, 919.707.8083. Images available upon request
Spiral structure is seen in a variety of natural objects, ranging from plants and animals to tropical cyclones and galaxies. Now researchers at the North Carolina Museum of Natural Sciences have developed a technique to accurately measure the winding arms of spiral galaxies that is so easy, virtually anyone can participate. This new and simple method is currently being applied in a citizen science project, called Spiral Graph, that takes advantage of a person’s innate ability to recognize patterns, and ultimately could provide researchers with some insight into how galaxies evolve.
Spiral galaxies, like our own Milky Way, make up approximately 70 percent of the galaxies in the nearby Universe. In many of these galaxies the difference in brightness between the winding arms and the inter-arm regions is very subtle, making it challenging for automated methods to measure. Even bright foreground stars can skew the automated analysis of a galaxy. Additionally, patterns in spiral galaxies are easily seen and followed by people but computer algorithms have a harder time determining where spirals begin and end, especially if they aren’t continuous.
The Spiral Graph project takes advantage of a time-honored short cut common in art classes — tracing. Ian Hewitt, Research Adjunct at the NC Museum of Natural Sciences, and Patrick Treuthardt, Assistant Head of the Museum’s Astronomy & Astrophysics Research Lab, tested their tracing method on a set of simple model images of spiral galaxies with known windings. They then traced out the spiral structure and measured the winding of the tracings with their own specially designed software, P2DFFT. When they compared their results against other approaches that involved an artificial intelligence program, fitting observed structure with mathematical models, or even directly inputting images into their own measurement software, none produced results as precise and accurate as their tracing method. A paper detailing this comparison appeared online on March 9, 2020. Spiral Graph is available on the Zooniverse.org platform for citizen science projects.
“These human-generated tracings give our software a boost so it can accurately measure how tightly wrapped the structure is,” Treuthardt says. “The degree of wrapping of the spiral arms is called the pitch angle. If a spiral pattern has very tightly wrapped arms, it has a small pitch angle. If the spiral pattern is very open, it has a large pitch angle.” Why is pitch angle important? Because it relates to other parameters of the host galaxy that are more difficult and time consuming to measure, such as the mass of the black hole found in the nucleus, or dark matter content of the galaxy. “If we know the pitch angle we can quickly and easily estimate these parameters and identify interesting galaxies for more detailed, follow-up telescope observations,” Treuthardt adds.
Hewitt’s work on this study, and the Spiral Graph citizen science project, is especially rewarding since he started out as a volunteer working with Treuthardt. Although a long-time amateur astronomer, Hewitt retired from a career in industry to pursue astronomy full time. He later completed a degree in astronomy and began teaching and working on programming projects in the Museum’s Astronomy & Astrophysics Research Lab. “It’s been really exciting to get a chance to participate in this kind of research, but even better to have a part in enabling others to contribute to the efforts to better understand our Universe,” says Hewitt. And with an estimated 6,000 galaxies in their study, enlisting citizen scientists is a must.
The paper, “Comparison of Galaxy Spiral Arm Pitch Angle Measurements Using Manual and Automated Techniques,” by Ian Hewitt and Patrick Treuthardt, was published in Monthly Notices of the Royal Astronomical Society by Oxford University Press on March 9, 2020. The software used to measure spiral arm winding,P2DFFT, can be found at https://treuthardt.github.io/P2DFFT/. Spiral Graph can be found at https://www.zooniverse.org/projects/astro-lab-ncmns/spiral-graph.
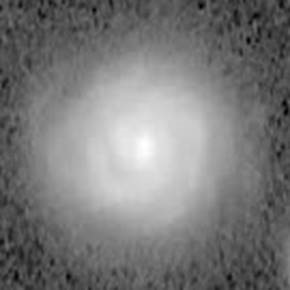
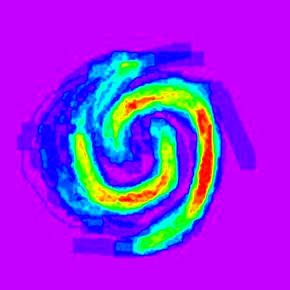
The left panel is an example of a real spiral galaxy that is shown to volunteers. The right panel is the sum of 15 independent tracings of the spiral structure of the same galaxy displayed using a violet to red rainbow color map. The violet areas indicate no agreement and the red areas indicate greatest agreement between tracings.
Note to Editors: The study abstract follows.
“Comparison of Galaxy Spiral Arm Pitch Angle Measurements Using Manual and Automated Techniques”
Authors: Ian Hewitt, North Carolina Museum of Natural Sciences; Patrick Treuthardt, North Carolina Museum of Natural Sciences
Published: TBD, Monthly Notices of the Royal Astronomical Society
DOI: 10.1093/mnras/staa354
Abstract: The pitch angle (PA) of arms in spiral galaxies has been found to correlate with a number of important parameters that are normally time-intensive and difficult to measure. Accurate PA measurements are, therefore, important in understanding the underlying physics of disk galaxies. We introduce a semi-automated method that improves upon a parallelized two-dimensional fast Fourier transform algorithm (P2DFFT) to estimate PA. Rather than directly inputting deprojected, star subtracted, and galaxy centered images into P2DFFT, our method (P2DFFT:Traced) takes visually traced spiral arms from deprojected galaxy images as input. The tracings do not require extensive expertise to complete. This procedure ignores foreground stars, bulge and/or bar structures, and allows for better discrimination between arm and inter-arm regions, all of which reduce noise in the results. We compare P2DFFT:Traced to other manual and automated methods of measuring PA using both simple barred and non-barred spiral galaxy models and a small sample of observed spiral galaxies with different representative morphologies. We find that P2DFFT:Traced produces results that, in general, are more accurate and precise than the other tested methods and it strikes a balance between total automation and time-consuming manual input to give reliable PA measurements.